The Right Way To Be Wrong#
With the rise of online machine learning competitions like Kaggle and an academic literature fixated on publishing papers showing marginal improvements in performance metrics on standard benchmarks, you could be forgiven for thinking that the hardest part of data science is finding the right model and features to max out standard metrics like Area Under the Curve (AUC), Accuracy (share of cases correctly classified) or F1 scores.
However, this is far from the case when it comes to solving real-world problems. Yes, advancement in academic computer science is often tied to one’s ability to write a new algorithm that performs marginally better on standard benchmarks, and most problem sets or online competitions you encounter will pre-specify how model performance will be evaluated.
But when it comes to solving real-world problems, determining what success looks like is actually a core part of your job as a data scientist. And what makes this task difficult is not how you measure your model’s successes — the number of true positives and true negatives the model generates — but in determining the types of mistakes it makes when it gets things wrong.
Understanding how a model fails is just as important as minimizing mistakes in the first place (i.e., maximizing accuracy). Depending on the context, there can be huge asymmetries regarding the consequences of false positives and false negatives. Tell someone with cancer they’re fine (false negative), and the result may be the death of the patient from an easily treatable condition; tell someone healthy there’s a chance they have cancer, and you may cause stress and additional tests, but the patient death is very unlikely.
Similarly (but in a much less scary context), classify a credit card applicant as a “good credit risk” who is not actually credit-worthy (a false positive), and your company may lose the credit limit on the card they issue; classify someone as high risk who is actually not, and your company may lose the transaction fees that customer would have generated, but they won’t lose tens of thousands of dollars in unpaid bills.
When answering Passive Prediction Questions, the choice of how to balance true positives, true negatives, false positives, and false negatives is the bridge between the math of statistics and machine learning and the specifics of real-world problems. And as a result, an ability to speak thoughtfully about how to balance these interests is one of the most important differentiators between data scientists who have only ever fit models for problem sets and data scientists business leaders trust to solve their problems.
Note
In case you need more motivation to care about how best to distribute your true and false positives and negatives to best solve your stakeholder’s problem, allow me to offer the following: if you are comfortable just endorsing a single success metric (accuracy, F1 score, AUC), most Passive Prediction Questions can be answered relatively well by automated tools. And that means that if the only thing that differentiates you from the next data scientist (or generation of chatGPT) is that you can get a slightly higher AUC than the person sitting next to you, how much value do you think you are likely bringing to your stakeholder (and thus how well paid)?
Don’t believe me? Consider scikit-learn — by design, nearly all of the algorithms in that package have the exact same APIs — you run test_train_split(), .fit(), and .predict(). That means it’s almost trivially easy to write a program that just loops over all the models in the library, fits them, and checks their performance against the simple metric you chose. Indeed, products exist that do just this, often under names like AutoML.
Will these do as well as a well trained data scientist? Not yet — there’s skill in feature engineering and choosing which path to go down when computationally constrained. And if you’re someone working at the forefront of developing new machine learning algorithms or infrastructure, then this does not apply to you. But if you are someone who is primarily interested in applying the best tools of data science to solve real world problems, then you should also bear in mind that anything easily computable lends itself to automation.[1]
Thinking carefully about your stakeholder’s problem and being able to get them to articulate the relative value they place on true and false positives and negatives, then translating that domain expertise into an optimization problem — that is a task that requires substantially more critical thinking and interpersonal skills, and consequently is less likely to be made obsolete any time soon.
The Problem with Accuracy#
Let’s begin our discussion about balancing true and false positives and negatives with my least favorite metric for classification problems: Accuracy.
There is perhaps no better way for a data scientist to demonstrate they don’t know what they’re doing than for them to proudly proclaim that their model has an accuracy score of ninety-something percent without additional context. And yet it is a mistake that I see constantly. It is as though, being students, young data scientists implicitly assume that accuracy scores, like grades, exist on an absolute scale, where values in the 90s are “A”s and something to celebrate and values in the 70s are “C”s and something to feel bad about, when in reality neither is necessarily the case.
How do I know this fallacy is common, you ask? As Director of Admissions for the Duke Masters of Interdisciplinary Data Science (MIDS) program, I read hundreds of Statements of Purpose essays and resumes every year from aspiring data scientists from around the world. And despite having done this for years, I continue to be shocked by the number of applicants who proudly proclaim something like “I fit a model using XYZ method and was able to achieve a 95% accuracy score,” or report an accuracy score in the 90s in their resume as though those numbers, absent context, were meaningful.
So why is reporting accuracy scores without context such a problem? There are at least three reasons.
Accuracy and Imbalanced Data#
Most data you will encounter in your career will be imbalanced, meaning that one of the outcomes you are trying to predict with your model (assuming a classification task) will be much, much less prevalent than the other. In these situations, because accuracy is just “the share of cases correctly classified,” getting high acccuracy can be achieved trivially by always predicting the more prevalent outcome.
To illustrate, consider routine mammograms. Mammograms are x-rays of women’s breast tissue used to screen for early signs of breast cancer. In the United States, it is recommended that all women over 40 get a mammogram every two years. Unsurprisingly, therefore, vast majority of routine mammograms are medically unremarkable. According to the Susan G. Komen society, roughly 90% of routine mammograms are perfectly normal and require no followup.[2] Thus a “model” that reports that any routine mammogram it is given is normal will immediately achieve an accuracy score of 90%.
Moreover, most data scientists wouldn’t even consider 90/10 data to be particularly imbalanced. In any given year in the United States, only about 3% of single-family residential mortgages are in a state of delinquency[3], and fraudulent credit card purchases make up less than one-tenth of 1% of all credit card transactions. That means a “model” that reports all mortgages are in good standing or that all credit card transactions are valid will immediately have accuracy scores of 97% and \(>\) 99.9%, respectively.
Relative to What?#
The second problem with reporting accuracy scores absent context is that the value of a model can only ever be evaluated relative to what came before. A model with a 93% accuracy score is unlikely to be of particular value to a business if the model they were using before you arrived had an accuracy score of 98%, and your model does not have any other benefits to offset its lower accuracy. Similarly, a model with an accuracy score of 70% may constitute a considerable innovation to a business that could not make predictions more accurately than with 50%-50% odds.
Indeed, a related issue with treating accuracy as an absolute scale akin to academic grades is that model performance depends on the amount of signal in the data on which it is trained. Data only has so much predictive information in it, and in theory, the way a model should be evaluated is in terms of how close it comes to harnessing that full predictive potential of the data on which it is being trained. Of course, we are not gods, and so we will never know the exact predictive potential of a given dataset, but the principle is one to bear in mind — the potential of a model is bounded by the data on which is being trained, and the only way to get a model that exceeds that true performance frontier is by overfitting your data (creating an illusion of better performance that will not hold up when the model is actually deployed).
But What About The Mistakes?#
The third reason reporting accuracy scores without context — and indeed the reason that accuracy is a problematic metric in general — is that it tells you nothing about the types of misclassifications your model is making. Are all its errors false positives? Are they all false negatives? In what ratio do they occur?
Accuracy says nothing about how different types of mistakes are being balanced, which is why accuracy is sometimes a fun statistic to use on problem sets but a terrible metric in the real world.
ROC and Area Under the Curve (AUC)#
“OK, fine,” I hear you say, “but no one uses accuracy anymore — we all use ROC AUC scores!”
First, again, I can tell you from reading hundreds of essays and looking at hundreds of resumes, accuracy is still an extremely commonly used metric. But setting that aside…
Yes, AUC is certainly a more holistic metric than accuracy. Where accuracy evaluates the share of cases correctly classified, AUC averages the share of correct positive predictions across the full range of classification thresholds (one of the reasons it is commonly used in competitions). But it is not a substitute for thinking carefully about the correct metric for the specific problem you are seeking to solve.
First, most models are deployed at a specific classification threshold, so averaging across all classification thresholds may create a good general purpose indicator of a model’s performance, but it makes AUC poorly suited to evaluating how well a model will perform in any specific context (i.e., at a specific classification threshold).
Second, the ROC AUC metric is myopically focused on the proportion of correct positive predictions. But depending on our problem, we may also care about the ratio of false negatives to false positives or other properties of our negative predictions.
Choosing the Best Way to be Wrong#
How, then, should one approach being more thoughtful about model evaluation?
The first step is always to evaluate the relative value of the four different types of classifications: true positives, true negatives, false positives, and false negatives. Writing a model that reviews the results of blood tests for signs of a terminal but treatable disease? You probably want to associate a strong negative value with false negatives (where you tell a sick patient they’re healthy) and a smaller negative value with false positives (being told you might have a lethal condition is stressful, even if later tests (which may have their own risks) may show it to be a false positive!). And you may then normalize your true positives and true negatives to zero.
You can then fit your classification model and, for each classification threshold, calculate the “cost” of the resulting distribution of true and false positives and negatives. Find the model and classification threshold that minimizes this problem-specific cost function, and you’ve identified the model and threshold that’s best for your specific problem.
Where do these values come from? Sometimes your stakeholder will be able to tell you the actual financial cost of different types of errors (e.g., when deciding whether to issue someone a credit card), but other times these values are more subjective. What’s the relative cost of falsely telling someone they may have a terminal disease condition? How might that vary depending on the risks associated with any followup procedures required to confirm a diagnosis or the amount of time it takes for the diagnosis to be confirmed? Those are hard, subjective questions you may not have the domain expertise to answer yourself. But because you understand the role of these values in how your eventual model will operate, you can raise these questions with your stakeholder (who should have better domain knowledge) and solicit values from them.
Note
Up until now, we’ve emphasized how we manage errors in the context of discrete, binary classification tasks, but it is worth emphasizing that this is only because binary classification is the easiest context in which to think about these problems. However, the issues raised her apply equally to classification tasks with more than two categories, and to efforts to answer Passive Prediction Questions about continuous outcomes. Latent in any model you use is a cost function, and implicit in that cost function is how mistakes are evaluated.
Linear regression, for example, minimizes the sum of squared errors across all observations, and (by default) it gives equal weight to the squared error associated with each observation. But if you don’t feel that’s an appropriate weighting scheme, you are not bound to it — weighted linear regression is a version of linear regression where the user provides a set of weights to associate with each observation. Have some customers you know are more valuable to your company? Perhaps you want to have the model give more weight to errors associated with those customers so the final model performs better for those customers. Or working with data from stores with different sales volumes? Maybe you want to give more weight to stores with larger sales volumes.
Don’t want to work with squared errors at all? Great! There’s a whole discipline called robust linear modeling that uses different norms for evaluating errors (often with the goal of reducing the influence of outliers, as the name implies, but all they are doing is modifying how the errors the model seeks to minimize are handled).
The Ethics of Misclassifications#
How our models make mistakes is often not just a financial decision; when statistical models are used to make high stakes decisions — like who is sent to prison and who is let out on bail pending trial — how errors are distributed can often be deeply, deeply ethically frought issue.
To illustrate, let’s consider the example of Risk Assessment models. Risk Assessment models are models used in the US criminal justice system that are designed to help judges and parole boards determine the risk that a criminal defendant or incarcerated person may re-offend if released from jail. These are increasingly commonly used for purposes like determining whether arrested individuals should be released while they await trial and whether incarcerated individuals should be paroled (released before the end of their prison sentence to a half-way house or monitored release).
The way Risk Assessment models are being used in the US has many, many problems. But a recent debate about an aspect of one of the most commonly used models — the COMPAS Risk Model — is illuminating about the moral issues that arise when handling misclassifications. If you would like to learn more about this debate and difference concepts of algorithmic fairness, I strongly recommend Bias In, Bias Out (2019), a Yale Law Journal article by Sandra G. Mayson.
In 2016, the investigative news outlet ProPublica published a piece about COMPAS called Machine Bias. In it, journalists Julia Angwin, Jeff Larson, Surya Mattu and Lauren Kirchner used data from Florida to evaluate how well the COMPAS risk assessment model predicted criminal recitivism (the term for when a criminal defendant commits another crime in the future).
The ProPublica analysis determined, in part, that:
Black defendants were often predicted to be at a higher risk of recidivism than they actually were. Our analysis found that black defendants who did not recidivate over a two-year period were nearly twice as likely to be misclassified as higher risk compared to their white counterparts (45 percent vs. 23 percent).
In other words, the false positive rate for Black defendants was higher than it was for White defendants.
While apparently rather damning of the model, COMPAS’ response was that this was actually a consequence of the fact that their model generated equal True Positive Rates across Black and White defendants. And while I am generally loath to defend COMPAS, as I think it has many problems and should not be in use, in this particular case they have a point.
As Sandra Mayson points out in her paper, the issue is that the likelihood someone will be arrested for a future crime (be arrested for recitivism) is imbalanced by race. As a consequence, a model that has the same True Positive Rate for Black and White defendants (i.e., the share of people predicted to re-offend who do re-offend is the same for both groups) will necessarily have different False Positive Rates for the two groups.
To illustrate, consider the following figure from Mayson’s paper with two groups, drawn as grey and black. Solid outlines are individuals who do not recitivate, while hollow figures are those who are re-arrested. In the grey group, 2/10 individuals are re-arrested, while only 1/10 are re-arrested in the black group. The vertical line represents the classification threshold used by the model.
Note that this implies the grey outlines are in the situation akin to that of Black Americans (more likely to be arrested for recitivism) and the black outlines are in the position of White Americans (less likely to be rearrested), which is a little confusing.
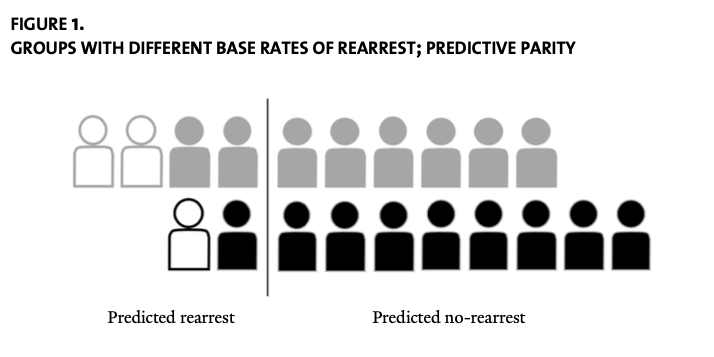
With the line in the location shown in the figure, we can see that the model has the same True Positive Rate for both populations — grey and black (50%). But as a result, the False Positive Rate is higher for the grey individuals (2/8). Thus while the ProPublica finding is true — the False Positive Rate of COMPAS is higher for Black defendants — the only way to even this out would be to shift the classification threshold for the black outlines over, as illustrated in Figure 2 from her paper:
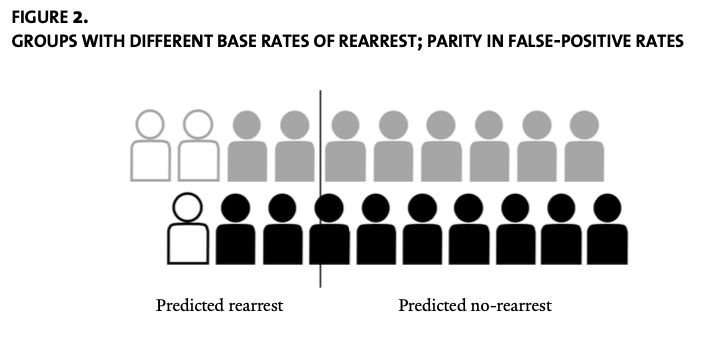
This balances the False Positive Rates for the two groups, but in doing so results in the True Positive Rate being lower for the black outlines.
Can we do better? Well, we could get equal True Positive Rates and False Positive Rates, but only by accepting differential False Negative rates, as illustrated in Mayson’s Figure 3:
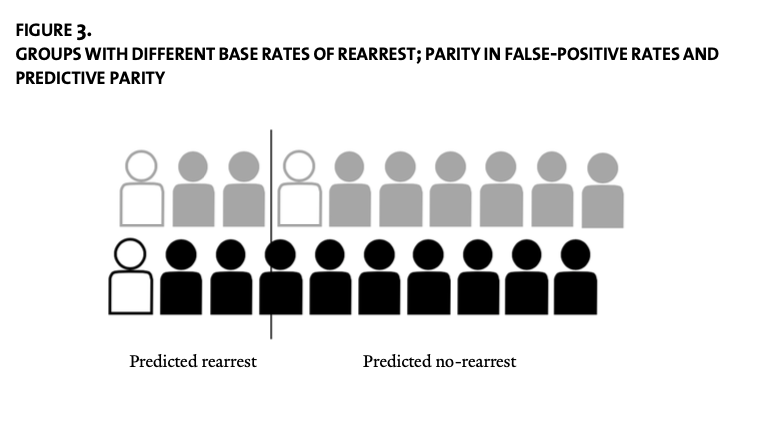
As Mayson writes:
As this example illustrates, if the base rate of the predicted outcome differs across racial groups, it is impossible to achieve (1) predictive parity; (2) parity in false-positive rates; and (3) parity in false-negative rates at the same time (unless prediction is perfect, which it never is). Computer scientists have provided mathematical proofs of this fact.[4] When base rates differ, we must prioritize one of these metrics at the expense of another. Race neutrality is not attainable.
Note
Please note that in the discussion of imbalanced recitivism arrest rates, I said arrested for recitivism — a huge problem with all of these risk assessment models is that we know from many studies that even in situations where Black and White Americans commit crimes at similar rates (like drug use), Black Americans are substantially more likely to be arrested for those crimes. Thus, an imbalance in arrests for recitivism do not necessarily imply differences in actual recitivism.
Indeed, this form of inequity is also a problem on the input side — Risk Assessment models take into account whether a defendant has prior convictions, but given Black Americans are more likely to be arrested even in situations where were know criminal behavior occurs at similar rates for Black and White Americans, and Black Americans are likely to have lower-incomes and thus less likely to have lawyers who can get charges dismissed, these models tend to treat them as higher risk.
So what is the right answer? Well, there isn’t one — each of these different schemes is defensible under different ethical frameworks. And that’s the problem — there’s no algorithm or machine learning metric that can tell you the “right” answer in a situation like this — it requires critical thought, engagement with prescriptive Questions, and careful discussion with your stakeholder.